Using Clang in Visual Studio Code
In this tutorial, you configure Visual Studio Code on macOS to use the Clang/LLVM compiler and debugger.
After configuring VS Code, you will compile and debug a C++ program in VS Code. This tutorial does not teach you about Clang or the C++ language. For those subjects, there are many good resources available on the Web.
If you have any trouble, feel free to file an issue for this tutorial in the VS Code documentation repository.
Prerequisites
To successfully complete this tutorial, you must do the following steps:
-
Install Visual Studio Code on macOS.
-
Install the C++ extension for VS Code. You can install the C/C++ extension by searching for 'C++' in the Extensions view (⇧⌘X (Windows, Linux Ctrl+Shift+X)).

Ensure Clang is installed
Clang might already be installed on your Mac. To verify that it is, open a macOS Terminal window and enter the following command:
clang --version
If Clang isn't installed, enter the following command to install the command line developer tools, which include Clang:
xcode-select --install
Create Hello World app
From the macOS Terminal, create an empty folder called projects where you can store all your VS Code projects, then create a subfolder called helloworld, navigate into it, and open VS Code in that folder by entering the following commands in the terminal window:
mkdir projects
cd projects
mkdir helloworld
cd helloworld
code .
The code . command opens VS Code in the current working folder, which becomes your "workspace". As you go through the tutorial, three files are created in the .vscode folder in your workspace:
tasks.json(compiler build settings)launch.json(debugger settings)c_cpp_properties.json(compiler path and IntelliSense settings)
Add a hello world source code file
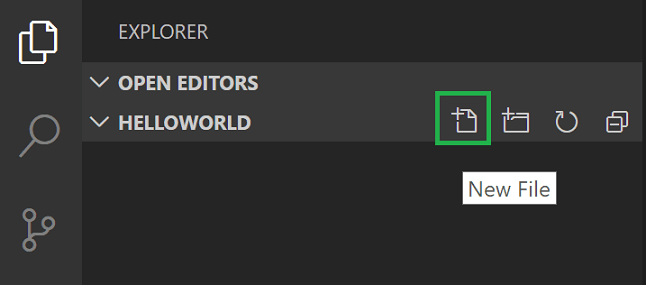
In the File Explorer title bar, select the New File button and name the file helloworld.cpp.
Paste in the following source code:
#include <iostream>
#include <vector>
#include <string>

using namespace std;

int main()
{
    vector<string> msg {"Hello", "C++", "World", "from", "VS Code", "and the C++ extension!"};

    for (const string& word : msg)
    {
        cout << word << " ";
    }
    cout << endl;
}
Now press ⌘S (Windows, Linux Ctrl+S) to save the file. Notice that your files are listed in the File Explorer view (⇧⌘E (Windows, Linux Ctrl+Shift+E)) in the side bar of VS Code:

You can also enable Auto Save to automatically save your file changes, by selecting File > Auto Save. You can find out more about the other views in the VS Code User Interface documentation.
Note: When you save or open a C++ file, you may see a notification from the C/C++ extension about the availability of an Insiders version, which lets you test new features and fixes. You can ignore this notification by selecting the
X(Clear Notification).
Explore IntelliSense
IntelliSense is a tool to help you code faster and more efficiently by adding code editing features such as code completion, parameter info, quick info, and member lists.
To see IntelliSense in action, hover over vector or string to see their type information. If you type msg. in line 10, you can see a completion list of recommended member functions to call, all generated by IntelliSense:
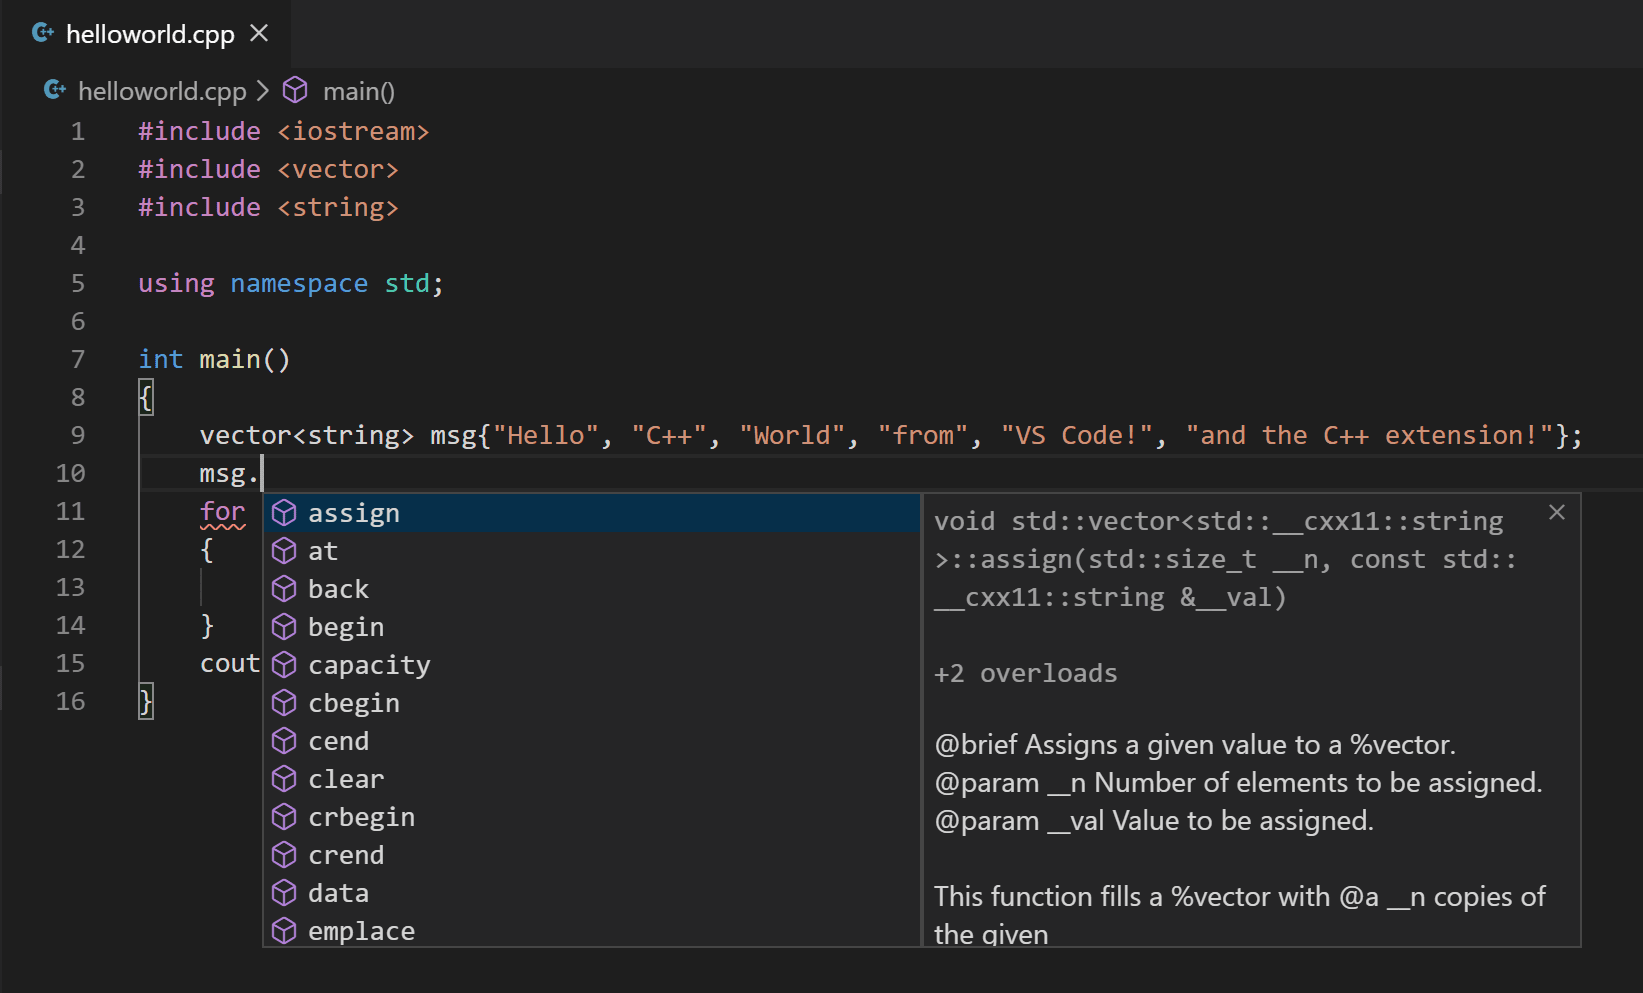
You can press the Tab key to insert the selected member. Then, when you add the opening parenthesis, information about arguments that the function requires is displayed.
If IntelliSense is not already configured, open the Command Palette (⇧⌘P (Windows, Linux Ctrl+Shift+P)) and enter Select IntelliSense Configuration. From the dropdown of compilers, select Use clang++ to configure. More information can be found in the IntelliSense configuration documentation.
Run helloworld.cpp
Remember, the C++ extension uses the C++ compiler you installed on your machine to build your program. Make sure you have a C++ compiler, such as Clang, installed before attempting to run and debug helloworld.cpp in VS Code.
-
Open
helloworld.cppso that it is the active file. -
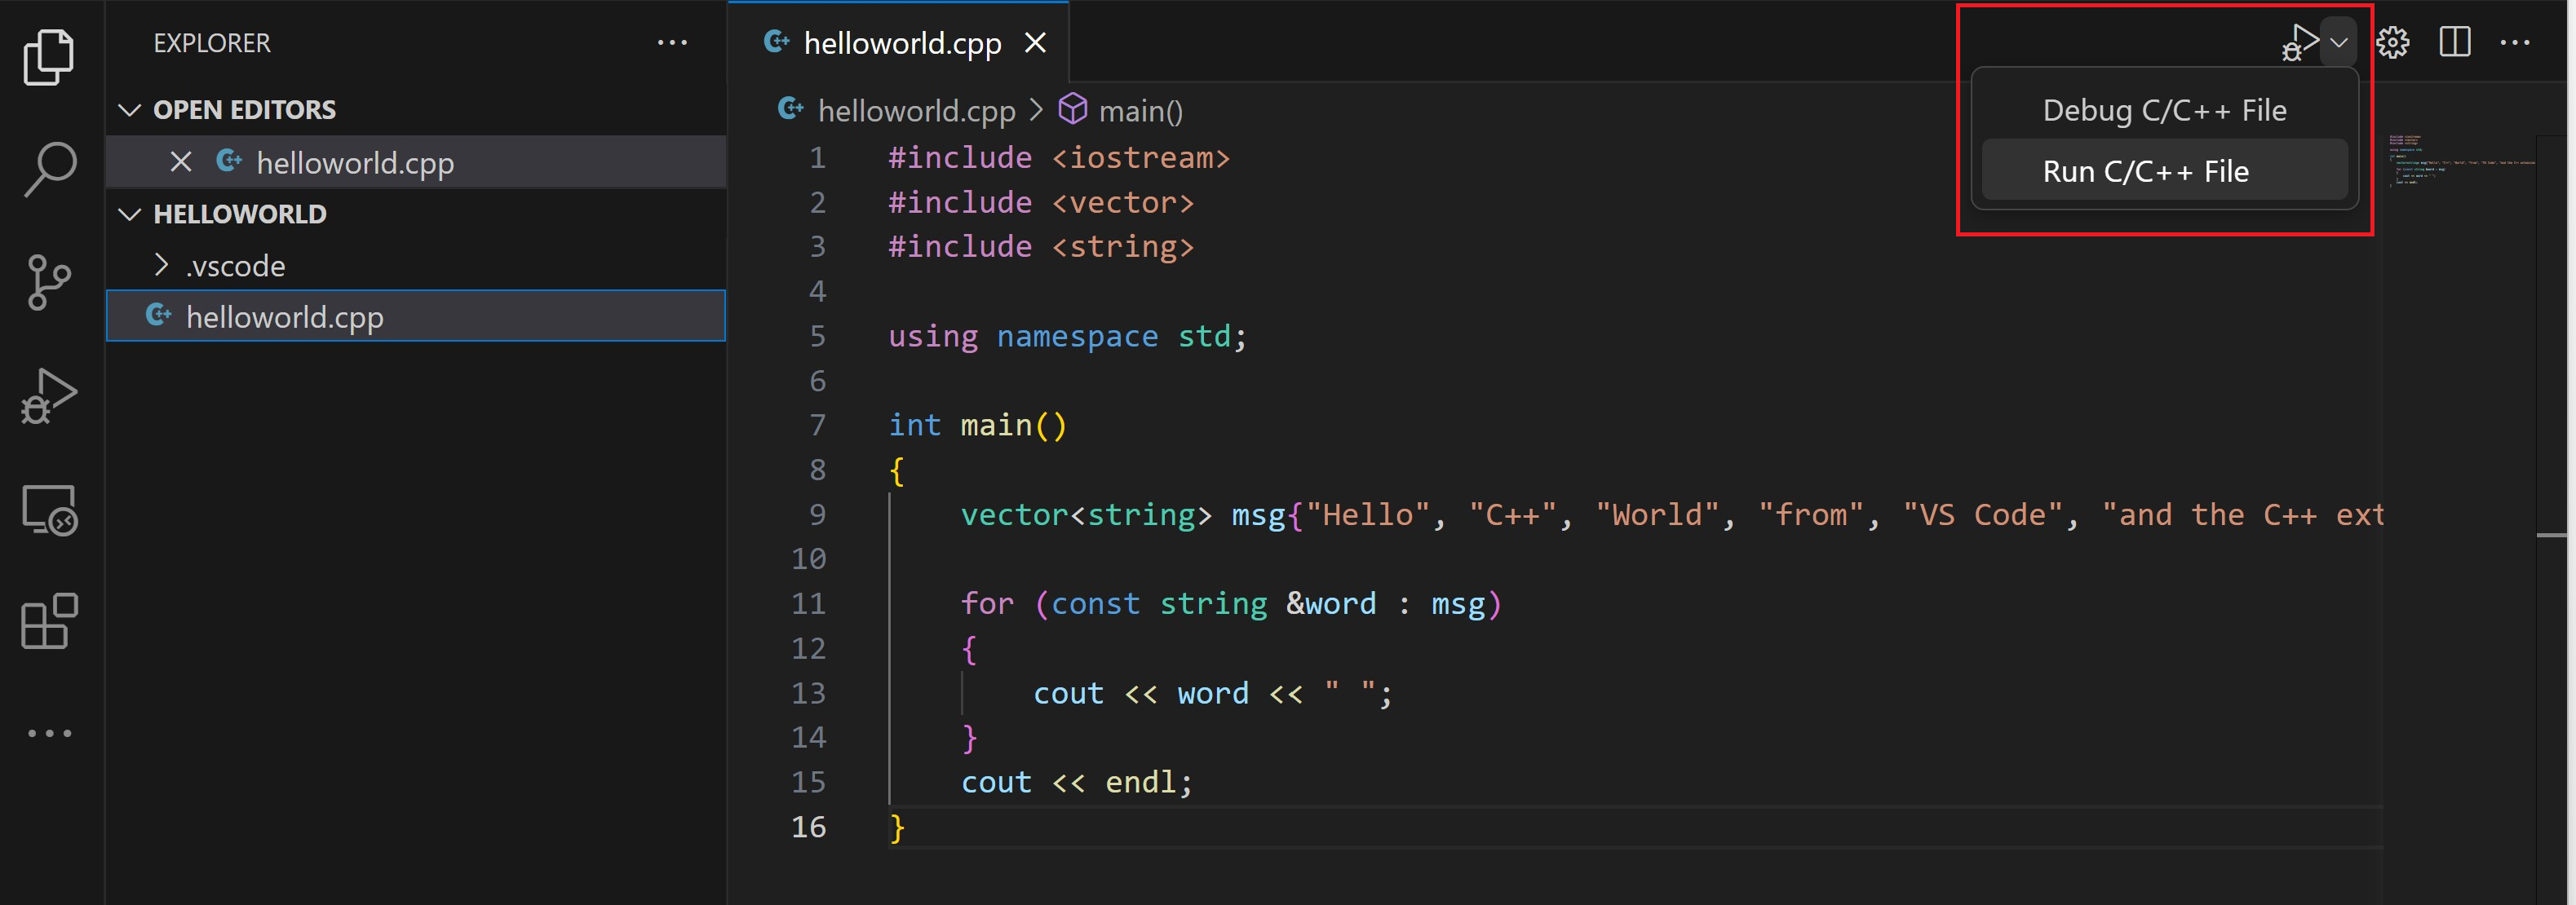
Press the play button in the top right corner of the editor.
-
Choose C/C++: clang++ build and debug active file from the list of detected compilers on your system.

You are only asked to choose a compiler the first time you run helloworld.cpp. This compiler is the "default" compiler set in tasks.json file.
-
After the build succeeds, your program's output will appear in the integrated Debug Console.

Congratulations! You've just run your first C++ program in VS Code!
Understanding tasks.json
The first time you run your program, the C++ extension creates tasks.json, located in your project's .vscode folder. tasks.json stores build configurations.
Here is a sample of a tasks.json file on macOS:
{
  "tasks": [
    {
      "type": "cppbuild",
      "label": "C/C++: clang++ build active file",
      "command": "/usr/bin/clang++",
      "args": [
        "-fcolor-diagnostics",
        "-fansi-escape-codes",
        "-g",
        "${file}",
        "-o",
        "${fileDirname}/${fileBasenameNoExtension}"
      ],
      "options": {
        "cwd": "${fileDirname}"
      },
      "problemMatcher": ["$gcc"],
      "group": {
        "kind": "build",
        "isDefault": true
      },
      "detail": "Task generated by Debugger."
    }
  ],
  "version": "2.0.0"
}
Note: You can learn more about
tasks.jsonvariables in the variables reference.
The command setting specifies the program to run. In this case, that isclang++.
The args array specifies the command-line arguments that are passed to clang++. These arguments must be specified in the order expected by the compiler.
This task tells the C++ compiler to take the active file (${file}), compile it, and create an output file (-o switch) in the current directory (${fileDirname}) with the same name as the active file but without the file extension (${fileBasenameNoExtension}). This process creates helloworld.
The label value is what you see in the tasks list, which is based on your personal preference.
The detail value is the description of the task in the tasks list. Update this string to differentiate it from similar tasks.
The problemMatcher value selects the output parser to use for finding errors and warnings in the compiler output. For clang++, the $gcc problem matcher creates the best results.
From now on, the play button always reads from tasks.json to figure out how to build and run your program. You can define multiple build tasks in tasks.json, and whichever task is marked as the default is the one used by the play button. In case you need to change the default compiler, you can run Tasks: Configure Default Build Task in the Command Palette. Alternatively you can modify the tasks.json file and remove the default by replacing this segment:
    "group": {
        "kind": "build",
        "isDefault": true
    },
with this:
"group": "build",
Modifying tasks.json
You can modify your tasks.json to build multiple C++ files by using an argument like "${workspaceFolder}/*.cpp" instead of "${file}". This builds all .cpp files in your current folder. You can also modify the output filename by replacing "${fileDirname}/${fileBasenameNoExtension}" with a hard-coded filename (for example "${workspaceFolder}/myProgram.out").
Debug helloworld.cpp
To debug your code,
-
Go back to
helloworld.cppso that it is the active file. -
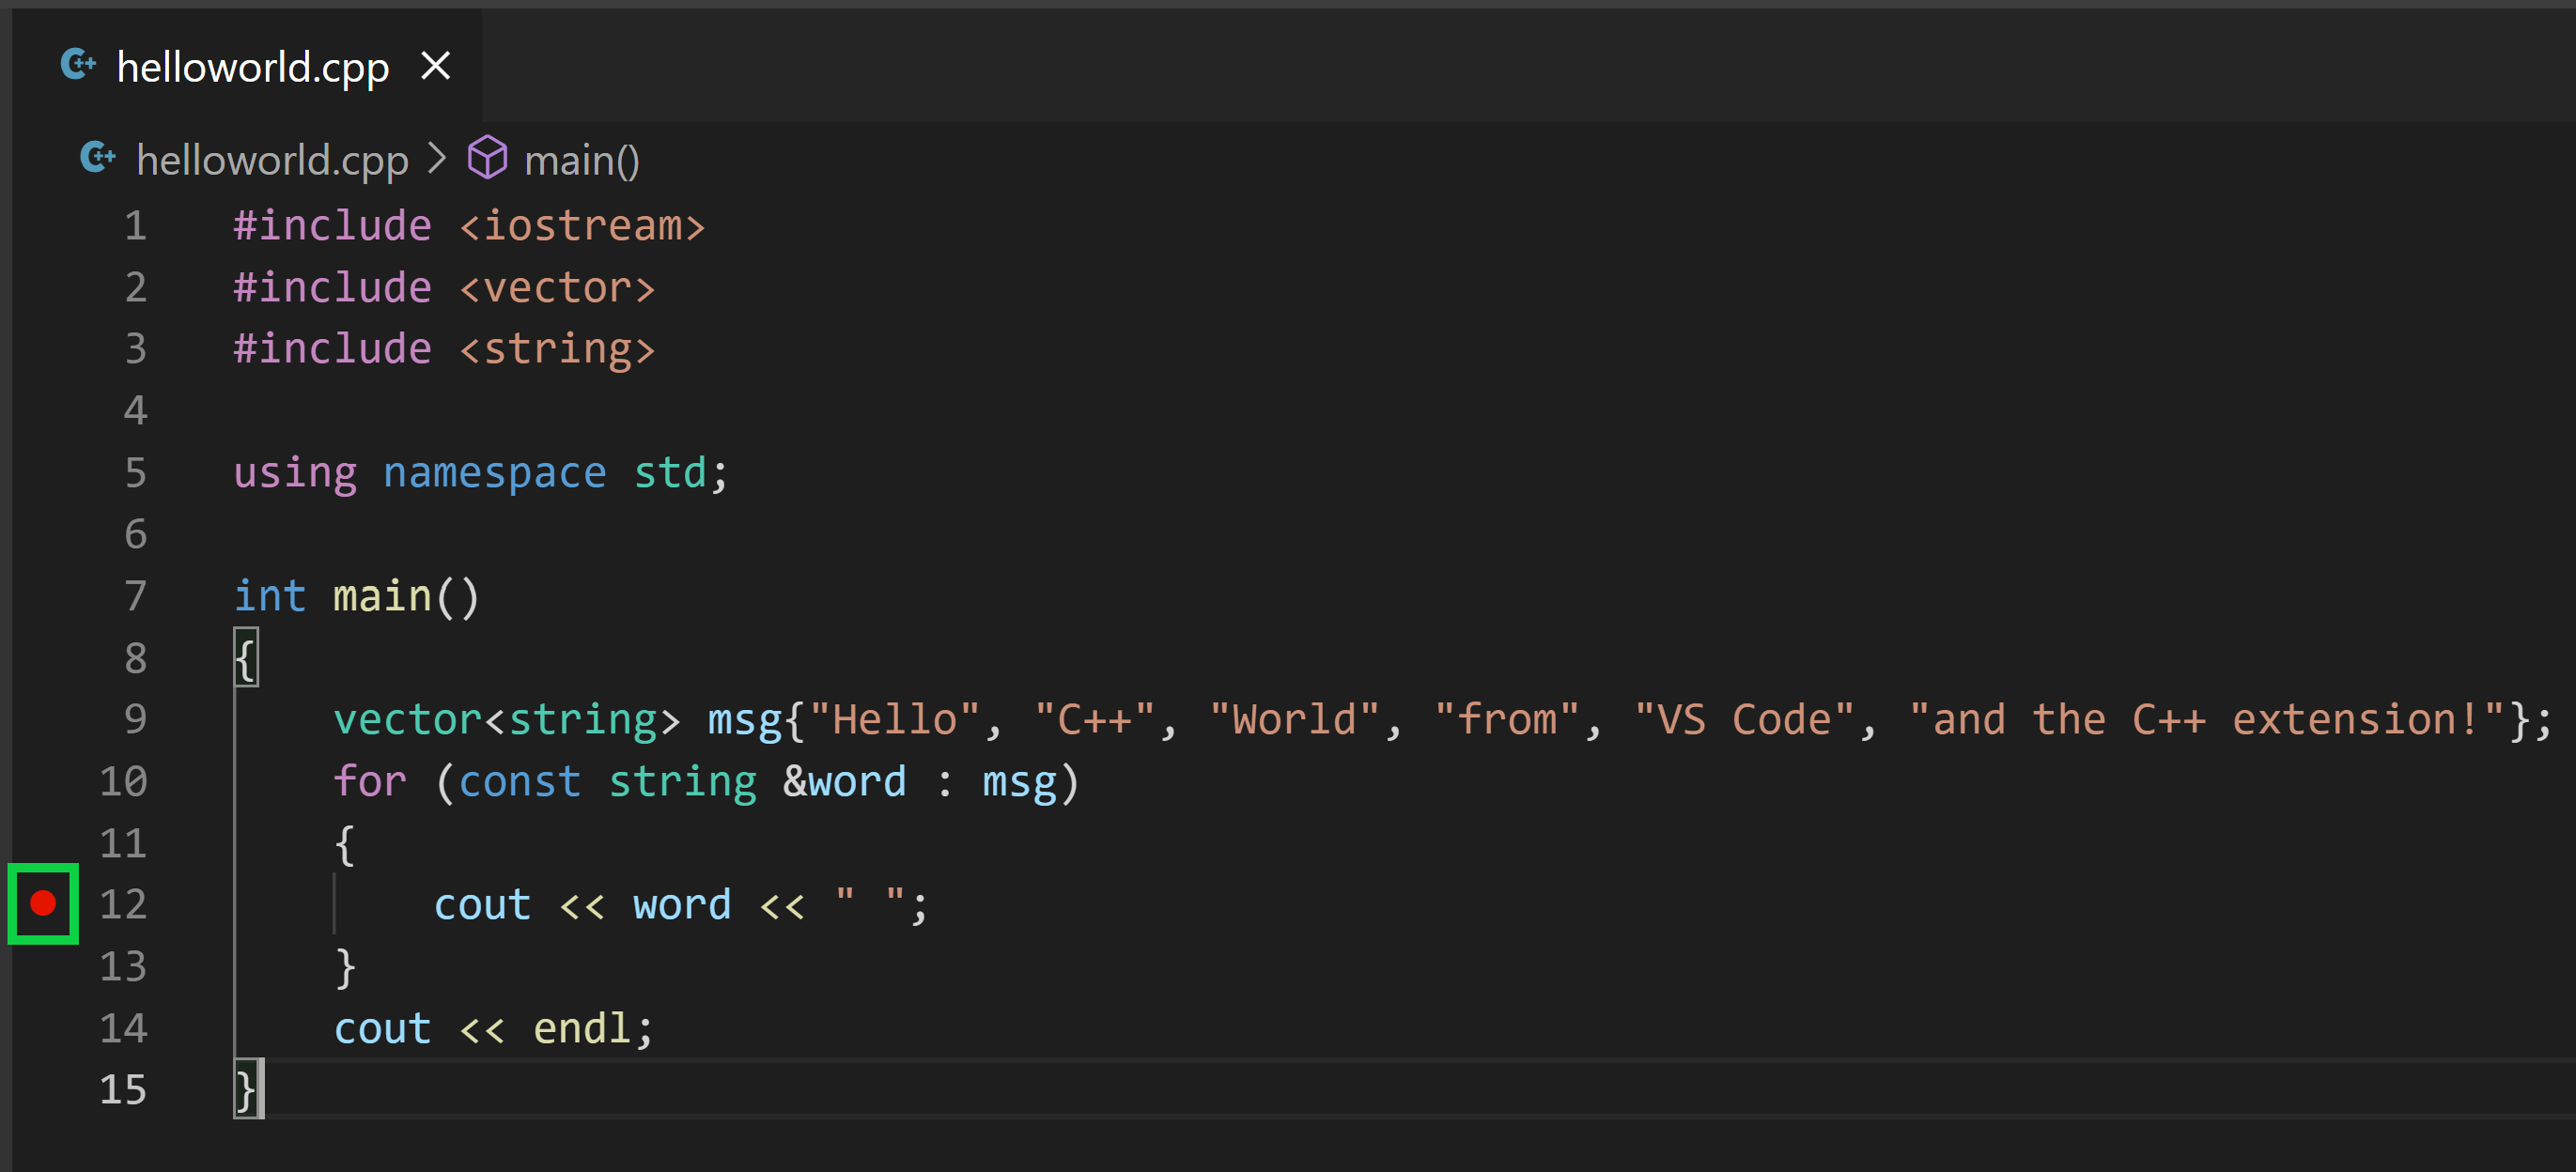
Set a breakpoint by clicking on the editor margin or using F9 on the current line.
-
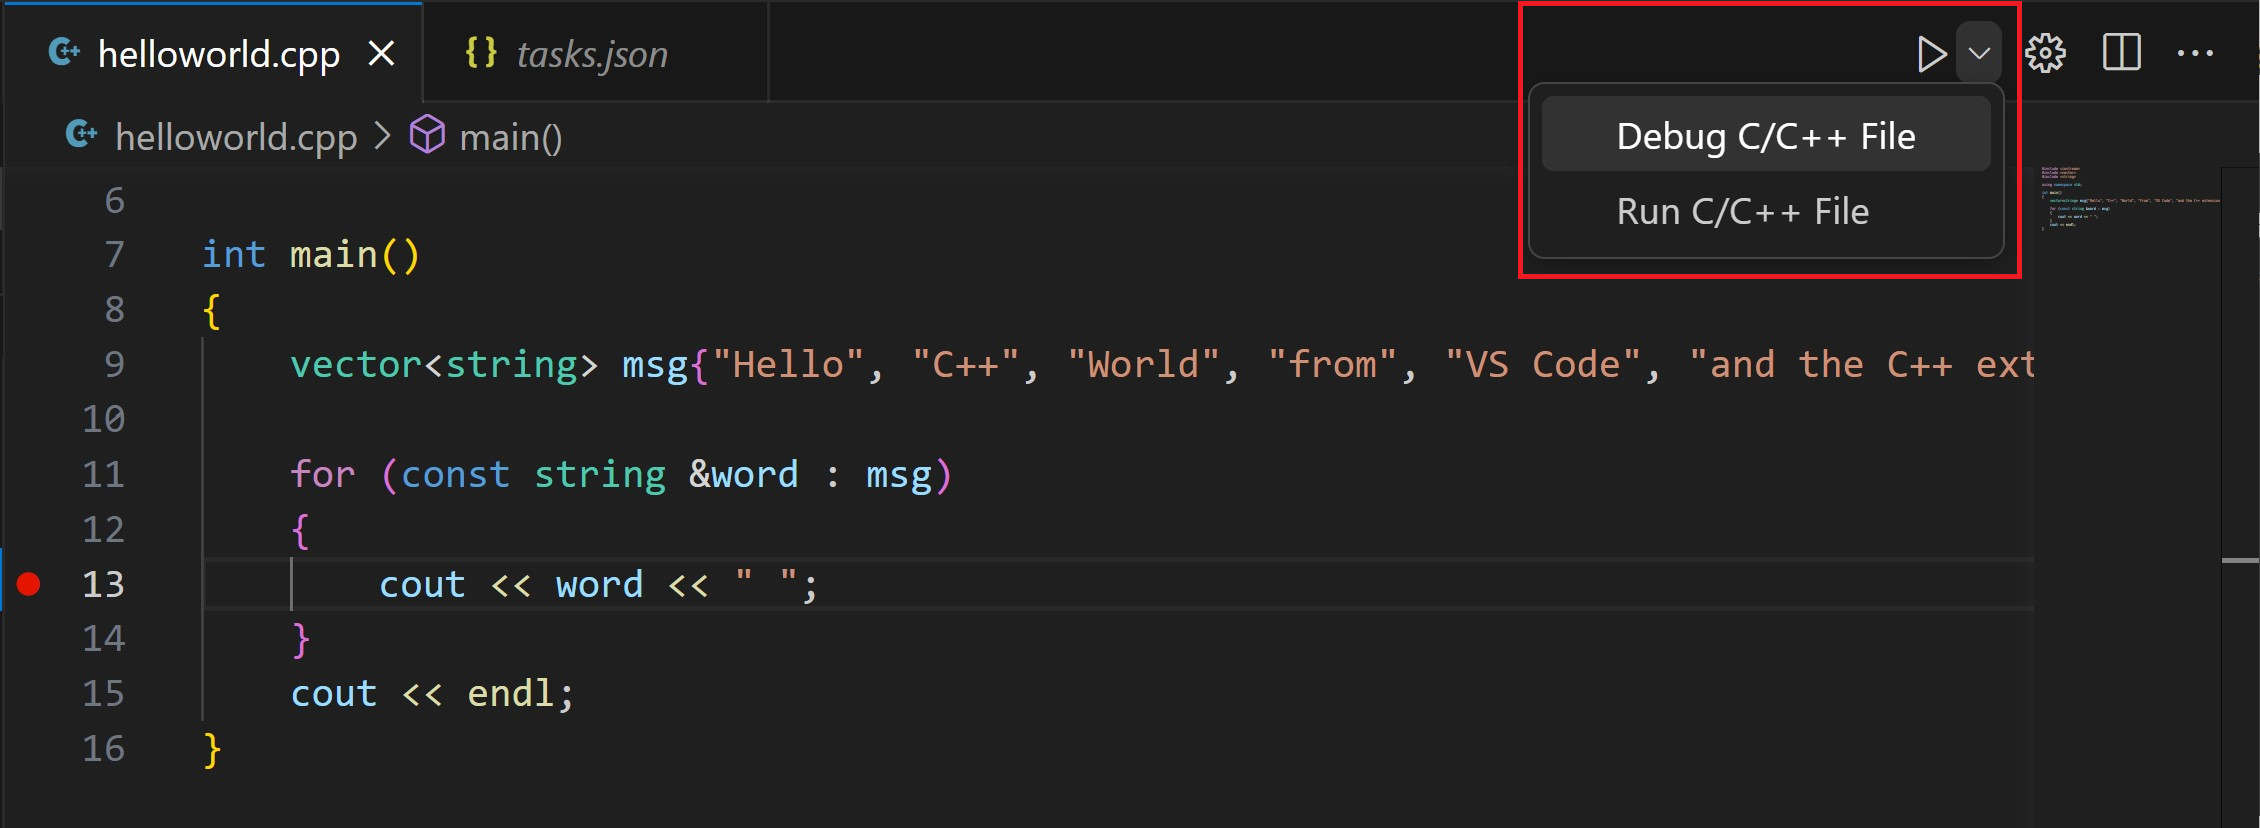
From the drop-down next to the play button, select Debug C/C++ File.
-
Choose C/C++: clang++ build and debug active file from the list of detected compilers on your system (you'll only be asked to choose a compiler the first time you run or debug
helloworld.cpp).
-
You will see the task execute and print out the output to the Terminal window.
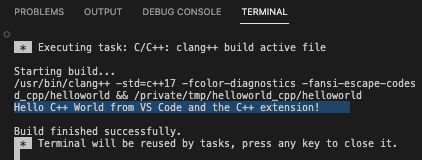
The play button has two modes: Run C/C++ File and Debug C/C++ File. The default is the last-used mode. If you see the debug icon in the play button, you can select the play button to debug, instead of selecting the drop-down menu item.
Explore the debugger
Before you start stepping through the code, let's take a moment to notice several changes in the user interface:
-
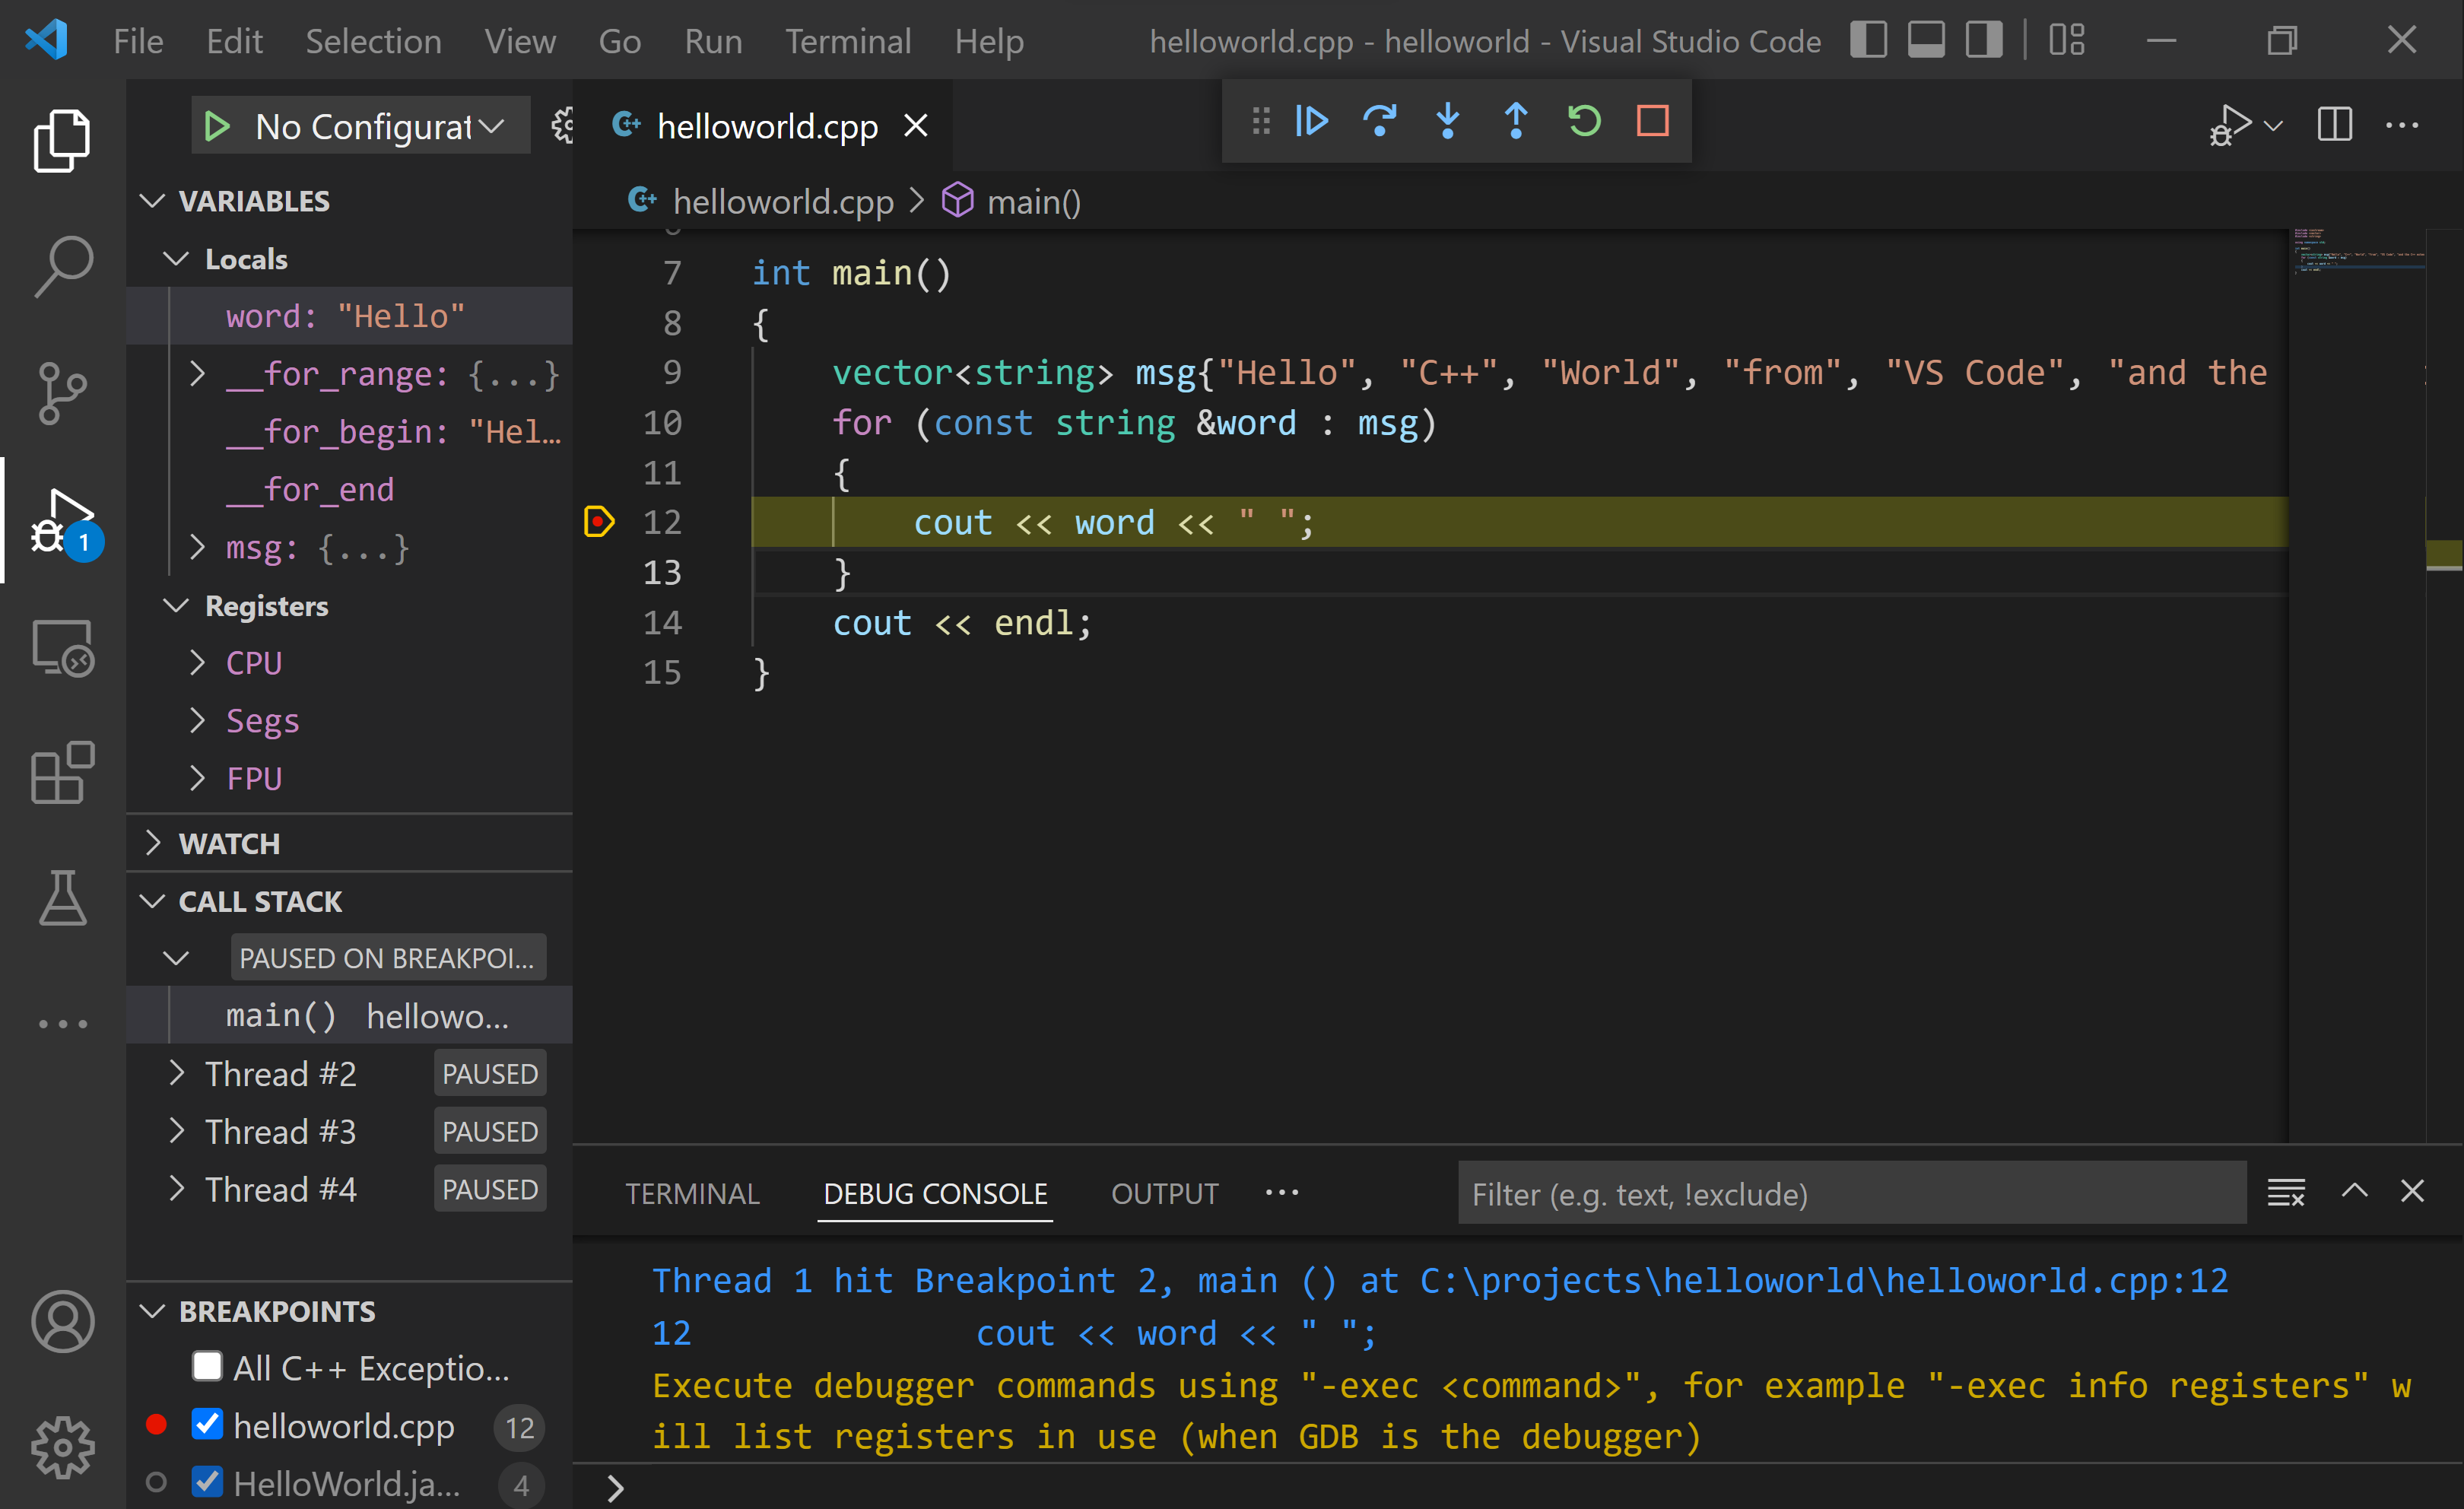
The Integrated Terminal appears at the bottom of the source code editor. In the Debug Console tab, you see output that indicates the debugger is up and running.
-
The editor highlights the line where you set a breakpoint before starting the debugger:
-
The Run and Debug view in the Activity Bar shows debugging information.
-
At the top of the code editor, a debugging control panel appears. You can move this around the screen by grabbing the dots on the left side.

Step through the code
Now you're ready to start stepping through the code.
-
Select the Step over icon in the debugging control panel so that the
for (const string& word : msg)statement is highlighted.
The Step Over command skips over all the internal function calls within the
vectorandstringclasses that are invoked when themsgvariable is created and initialized. Notice the change in the Variables window. The contents ofmsgare visible because that statement has completed. -
Press Step over again to advance to the next statement (skipping over all the internal code that is executed to initialize the loop). Now, the Variables window shows information about the loop variable.
-
Press Step over again to execute the
coutstatement. -
If you like, you can keep pressing Step over until all the words in the vector have been printed to the console. But if you are curious, try pressing the Step Into button to step through source code in the C++ standard library!
Set a watch
You might want to keep track of the value of a variable as your program executes. You can do this by setting a watch on the variable.
-
In the Watch window, select the plus sign and type
wordin the text box. This is the name of the loop variable. Now view the Watch window as you step through the loop.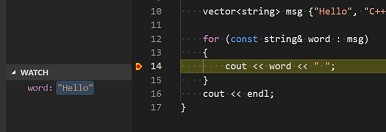
Note: the value of the watch variable is only available when the program execution is within the scope of the variable. For example, for a loop variable, the value is only available when the program is executing the loop.
-
Add another watch by adding this statement before the loop:
int i = 0;. Then, inside the loop, add this statement:++i;. Now add a watch forias you did in the previous step. -
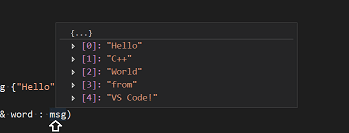
You can hover over any variable with the mouse pointer while execution is paused to quickly view its value.
Customize debugging with launch.json
When you debug with the play button or F5, the C++ extension creates a dynamic debug configuration on the fly.
There are cases where you'd want to customize your debug configuration, such as specifying arguments to pass to the program at runtime. You can define custom debug configurations in a launch.json file.
To create launch.json, choose Add Debug Configuration from the play button drop-down menu.

You'll then see a dropdown for various predefined debugging configurations. Choose C/C++: clang++ build and debug active file.

VS Code creates a launch.json file, which looks something like this:
{
  "configurations": [
    {
      "name": "C/C++: clang++ build and debug active file",
      "type": "cppdbg",
      "request": "launch",
      "program": "${fileDirname}/${fileBasenameNoExtension}",
      "args": [],
      "stopAtEntry": false,
      "cwd": "${fileDirname}",
      "environment": [],
      "externalConsole": false,
      "MIMode": "lldb",
      "preLaunchTask": "C/C++: clang++ build active file"
    }
  ],
  "version": "2.0.0"
}
The program setting specifies the program you want to debug. Here it is set to the active file folder ${fileDirname} and active filename ${fileBasenameNoExtension}, which if helloworld.cpp is the active file will be helloworld. The args property is an array of arguments to pass to the program at runtime.
By default, the C++ extension does not add any breakpoints to your source code and the stopAtEntry value is set to false.
Change the stopAtEntry value to true to cause the debugger to stop on the main method when you start debugging.
Ensure that the preLaunchTask value matches the label of the build task in the tasks.json file.
From now on, the play button and F5 will read from your
launch.jsonfile when launching your program for debugging.
Adding additional C/C++ settings
For more control over the C/C++ extension, create a c_cpp_properties.json file, which allows you to change settings such as the path to the compiler, include paths, which C++ standard to compile against (such as C++17), and more.
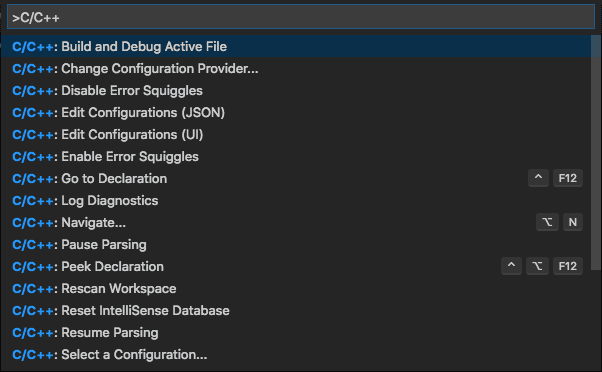
View the C/C++ configuration UI by running the command C/C++: Edit Configurations (UI) from the Command Palette (⇧⌘P (Windows, Linux Ctrl+Shift+P)).
This opens the C/C++ Configurations page.
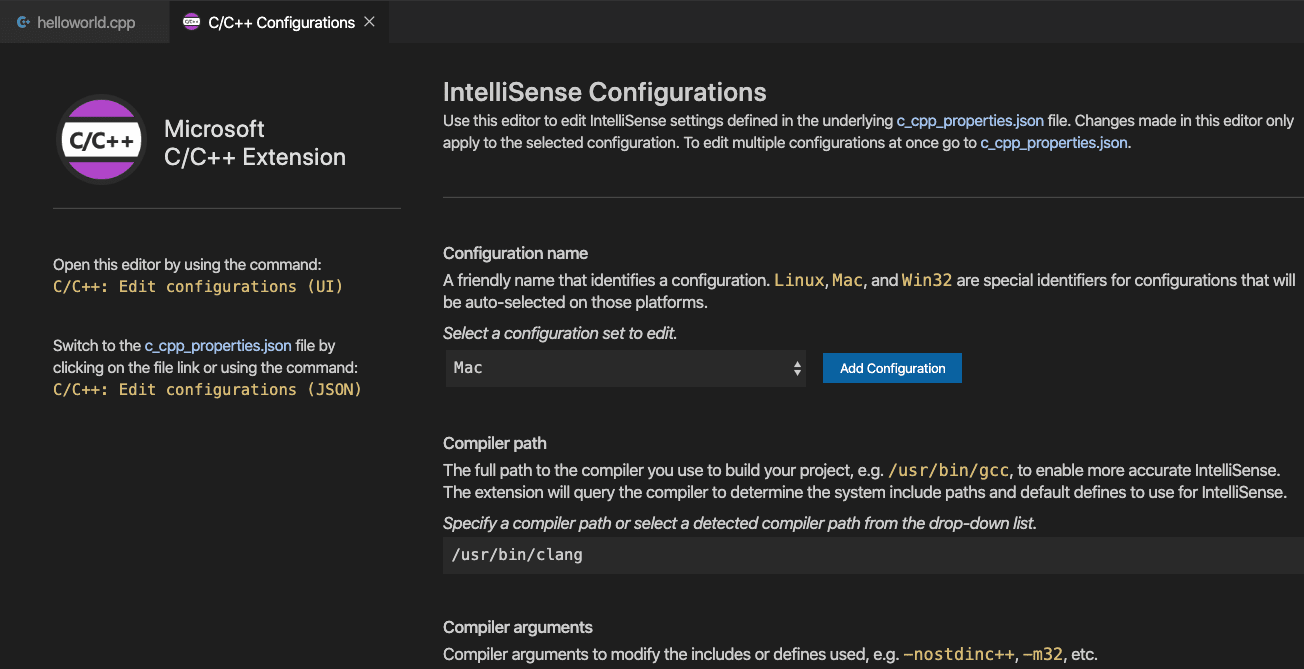
Visual Studio Code places these settings in .vscode/c_cpp_properties.json. If you open that file directly, it should look something like this:
{
  "configurations": [
    {
      "name": "Mac",
      "includePath": ["${workspaceFolder}/**"],
      "defines": [],
      "macFrameworkPath": [
        "/Library/Developer/CommandLineTools/SDKs/MacOSX.sdk/System/Library/Frameworks"
      ],
      "compilerPath": "/usr/bin/clang",
      "cStandard": "c11",
      "cppStandard": "c++17",
      "intelliSenseMode": "macos-clang-arm64"
    }
  ],
  "version": 4
}
You only need to modify the Include path setting if your program includes header files that are not in your workspace or the standard library path.
Compiler path
The extension uses the compilerPath setting to infer the path to the C++ standard library header files. When the extension knows where to find those files, it can provide features like smart completions and Go to Definition navigation.
The C/C++ extension attempts to populate compilerPath with the default compiler location based on what it finds on your system. The compilerPath search order is:
- Your PATH for the names of known compilers. The order the compilers appear in the list depends on your PATH.
- Then hard-coded Xcode paths are searched, such as
/Applications/Xcode.app/Contents/Developer/Toolchains/XcodeDefault.xctoolchain/usr/bin/
For more information, see the IntelliSense configuration documentation.
Mac framework path
On the C/C++ Configuration screen, scroll down and expand Advanced Settings and ensure that Mac framework path points to the system header files. For example: /Library/Developer/CommandLineTools/SDKs/MacOSX.sdk/System/Library/Frameworks
Troubleshooting
Compiler and linking errors
The most common cause of errors (such as undefined _main, or attempting to link with file built for unknown-unsupported file format, and so on) occurs when helloworld.cpp is not the active file when you start a build or start debugging. This is because the compiler is trying to compile something that isn't source code, like your launch.json, tasks.json, or c_cpp_properties.json file.
If you see build errors mentioning "C++11 extensions", you might not have updated your tasks.json build task to use the clang++ argument --std=c++17. By default, clang++ uses the C++98 standard, which doesn't support the initialization used in helloworld.cpp. Make sure to replace the entire contents of your tasks.json file with the code block provided in the Run helloworld.cpp section.
Terminal won't launch for input
On macOS Catalina and onwards, you might have the issue where you are unable to enter input, even after setting "externalConsole": true. A terminal window opens, but it does not actually allow you to type any input.
The issue is currently tracked #5079.
The workaround is to have VS Code launch the terminal once. You can do this by adding and running this task in your tasks.json:
{
  "label": "Open Terminal",
  "type": "shell",
  "command": "osascript -e 'tell application \"Terminal\"\ndo script \"echo hello\"\nend tell'",
  "problemMatcher": []
}
You can run this specific task using Terminal > Run Task... and select Open Terminal.
Once you accept the permission request, then the external console should appear when you debug.
Next steps
- Explore the VS Code User Guide.
- Review the Overview of the C++ extension
- Create a new workspace, copy your .json files to it, adjust the necessary settings for the new workspace path, program name, and so on, and start coding!