Testing
Software testing is a crucial aspect of the software development process. It helps ensure that your code works as expected and catches bugs early in the development cycle. Visual Studio Code provides a rich set of features for testing your code. You can automatically discover tests in your project, run and debug your tests, and get test coverage results.
In this article, you'll learn how to get started with testing in VS Code, discover popular testing extensions, and explore the testing capabilities.
Getting started with testing in VS Code
Testing support in VS Code is language-specific and depends on the extensions you have installed. Language extensions or standalone extension can implement the testing features for a particular language or testing framework. To get started with testing in VS Code, first install the appropriate extension for your project.
After you have installed the extension, you can start discovering and running tests in your project. The Test Explorer provides a centralized place to manage and run your tests.
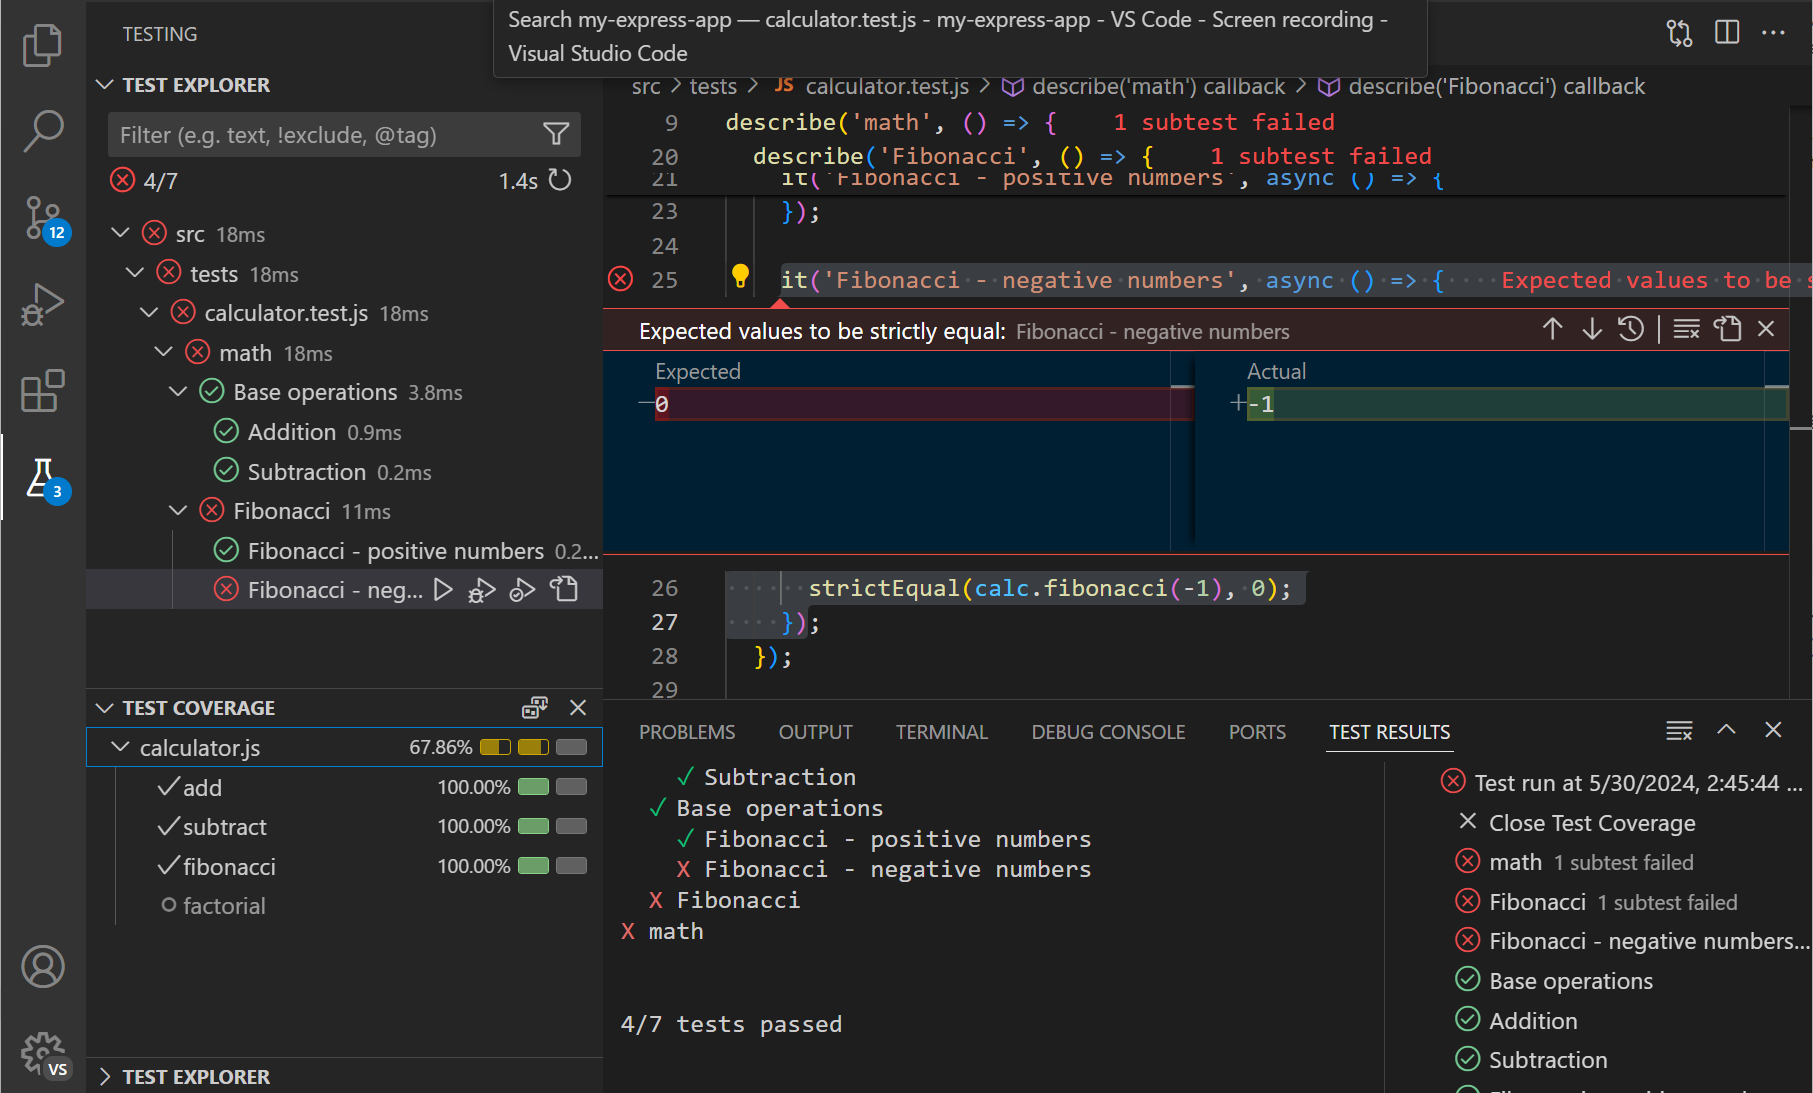
After you run your tests, you can view the test results in the Test Explorer view, editor gutter, and Test Results panel. To diagnose issues with your tests, you can also run and debug tests and set breakpoints in your test and application code.
You can also run tests with coverage to see how much of your code is covered by your tests. Test coverage helps you identify areas of your code that are not being tested and ensures that your tests are comprehensive. You can view the test coverage results in different views in the editor and Test Coverage panel.
To optimize your testing workflow, you can create tasks to run your tests, and optionally run your tests in the background with every code change.
Testing extensions
You can find extensions that support testing by looking in the Visual Studio Marketplace. You can also go to the Extensions view (⇧⌘X (Windows, Linux Ctrl+Shift+X)), and filter by the Testing category.
Tip: The extensions shown above are dynamically queried. Select an extension tile to read the description and reviews to decide which extension is best for you.
Automatic test discovery in Test Explorer
The Test Explorer view provides a centralized place to manage and run your tests. You can access the Test Explorer view by selecting the beaker icon in the Activity Bar or by using the Testing: Focus on Test Explorer View command in the Command Palette (⇧⌘P (Windows, Linux Ctrl+Shift+P)).
If you have a project with tests, the Test Explorer view discovers and lists the tests in your workspace. By default, the discovered tests are displayed in a tree view in the Test Explorer. The tree view matches the hierarchical structure of your tests, making it easy to navigate and run your tests.
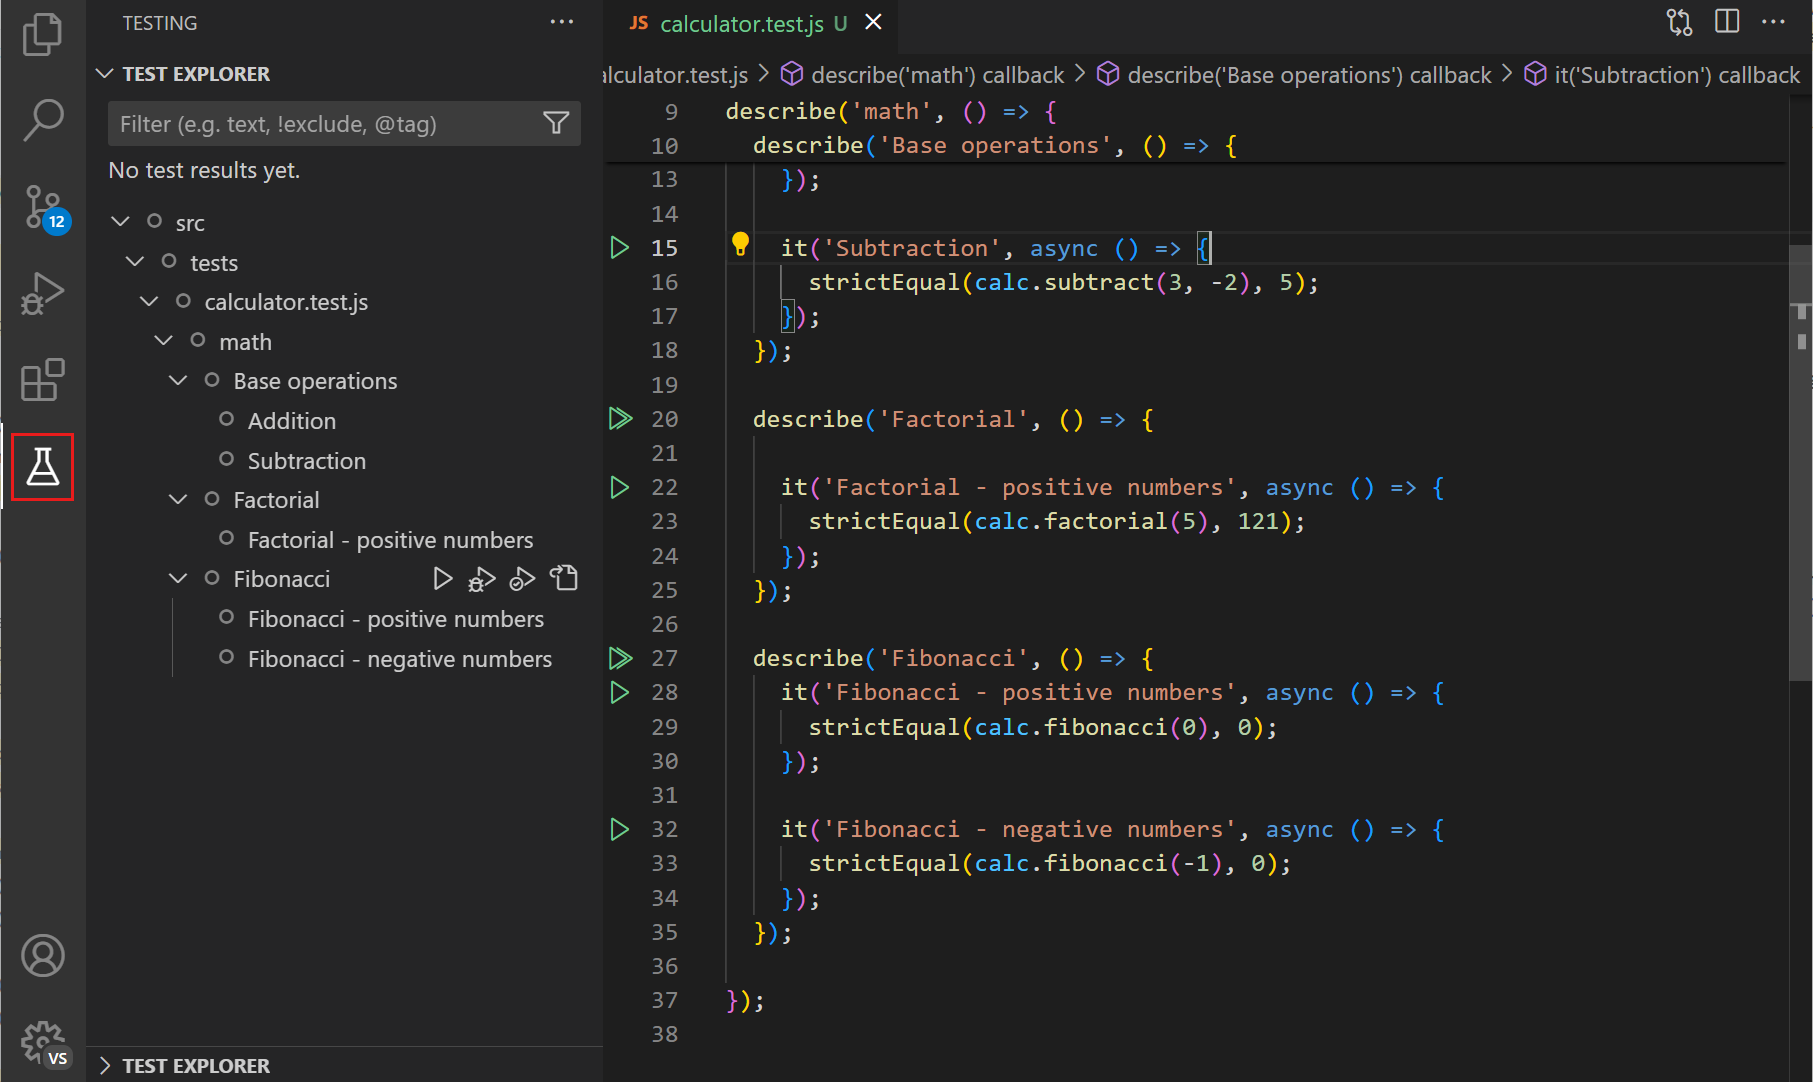
You can run tests from the Test Explorer by selecting the play button. Learn more about running and debugging tests in the Run and debug tests section.
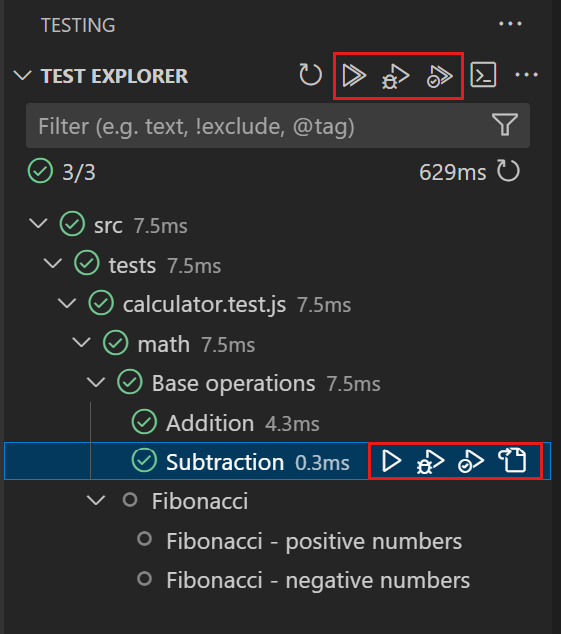
The tree view shows the test result status for each test by using a visual indicator, and enables you to run and debug tests, and navigate to the test code.
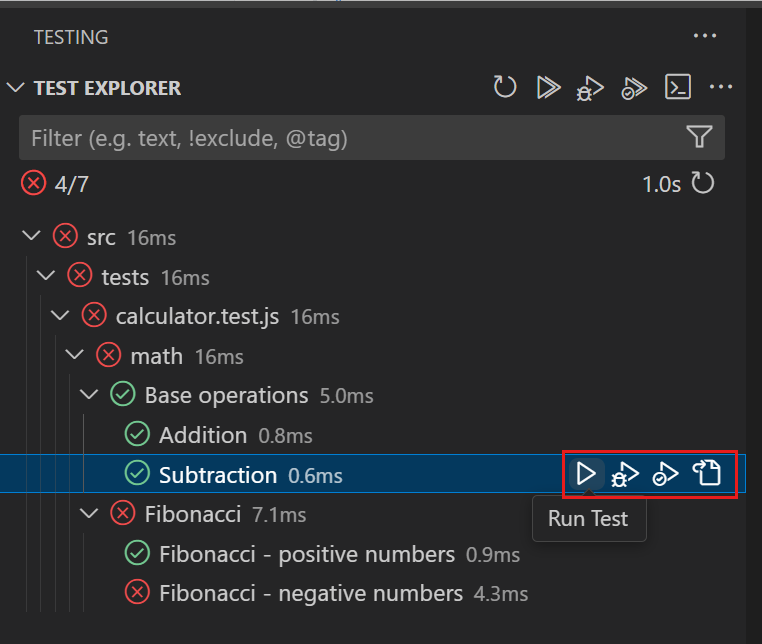
Tip: You can navigate to the test code by double-clicking on the test in the Test Explorer view. If you select a test that failed, the editor opens the test file, highlights the failed test, and shows the error message.
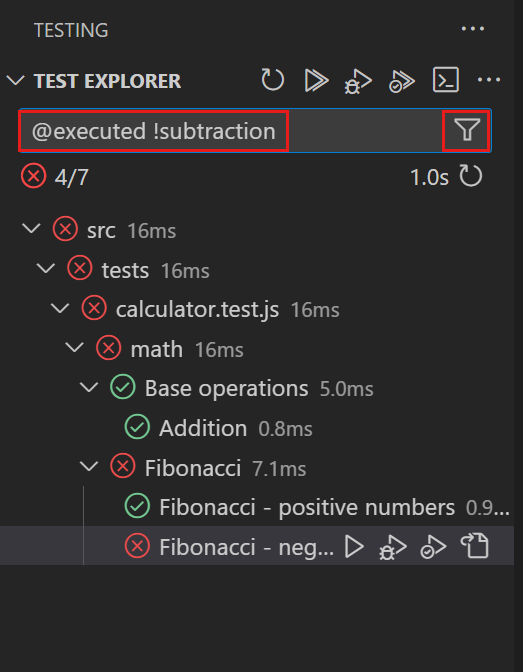
If you have many tests, you can use the filtering options to quickly find the tests you're interested in. You can use the Filter button to filter tests by status or only show tests for the current file. You can also use the search box to search for specific tests by name or use the @ symbol to search by status.
In the More Actions menu, you can access additional functionality, such as sort and display options.
If you add new tests or make changes to your tests, use the Refresh Tests button to refresh the list of tests in the Test Explorer. You can also use the Test Explorer: Reload tests command in the Command Palette (⇧⌘P (Windows, Linux Ctrl+Shift+P)).
Note: Depending on the testing extension, you might first have to configure the test framework or test runner to discover the tests in your project. Consult the documentation of the testing extension for more information.
Run and debug tests
After the discovery of the tests in your project, you can run and debug your tests, and view test results directly from within VS Code. You have multiple options to run and debug tests:
- Use the actions in the Test Explorer view to run all or a subset of tests
- Use the controls in the editor gutter to run tests while you're editing your test code
- Use the commands to run tests from the Command Palette (⇧⌘P (Windows, Linux Ctrl+Shift+P))
In the Test Explorer, use the controls in the section heading to run or debug all tests. You can also run or debug individual tests by selecting the play or debug icon next to the test name. In the tree view, when you select to run or debug on a specific node, all tests under that node are run or debugged.
While you're viewing your test code in the editor, you can use the play control in the gutter to run the test at the current cursor position. Right-click on the gutter control to view other actions, such as debugging the test.
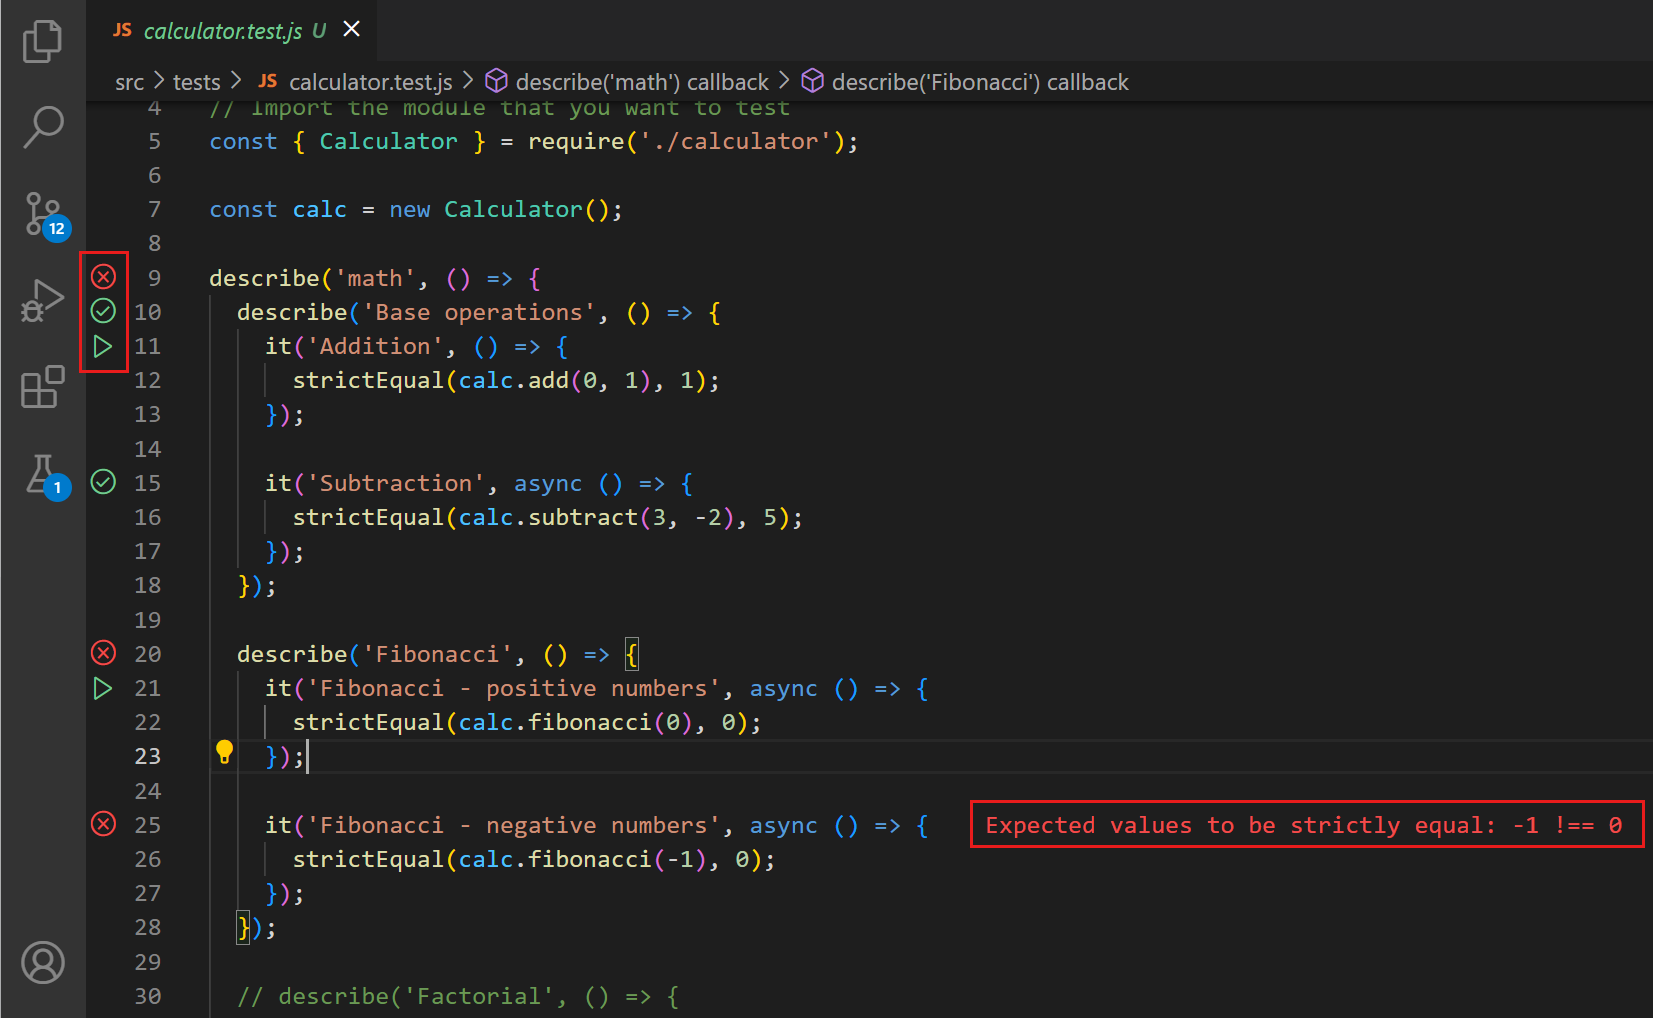
Tip: you can configure the default testing action for the gutter control by using the testing.defaultGutterClickAction setting.
After running a test, the editor gutter displays the test status.
When you run tests, the test result status is displayed in the Test Explorer view and editor gutter. The test results are color-coded to indicate the status of the test (pass or fail). When a test fails, notice that the test error message is shown as an overlay in the editor.
Use the Show Output button in the Test Explorer to view the test output in the Test Results panel.
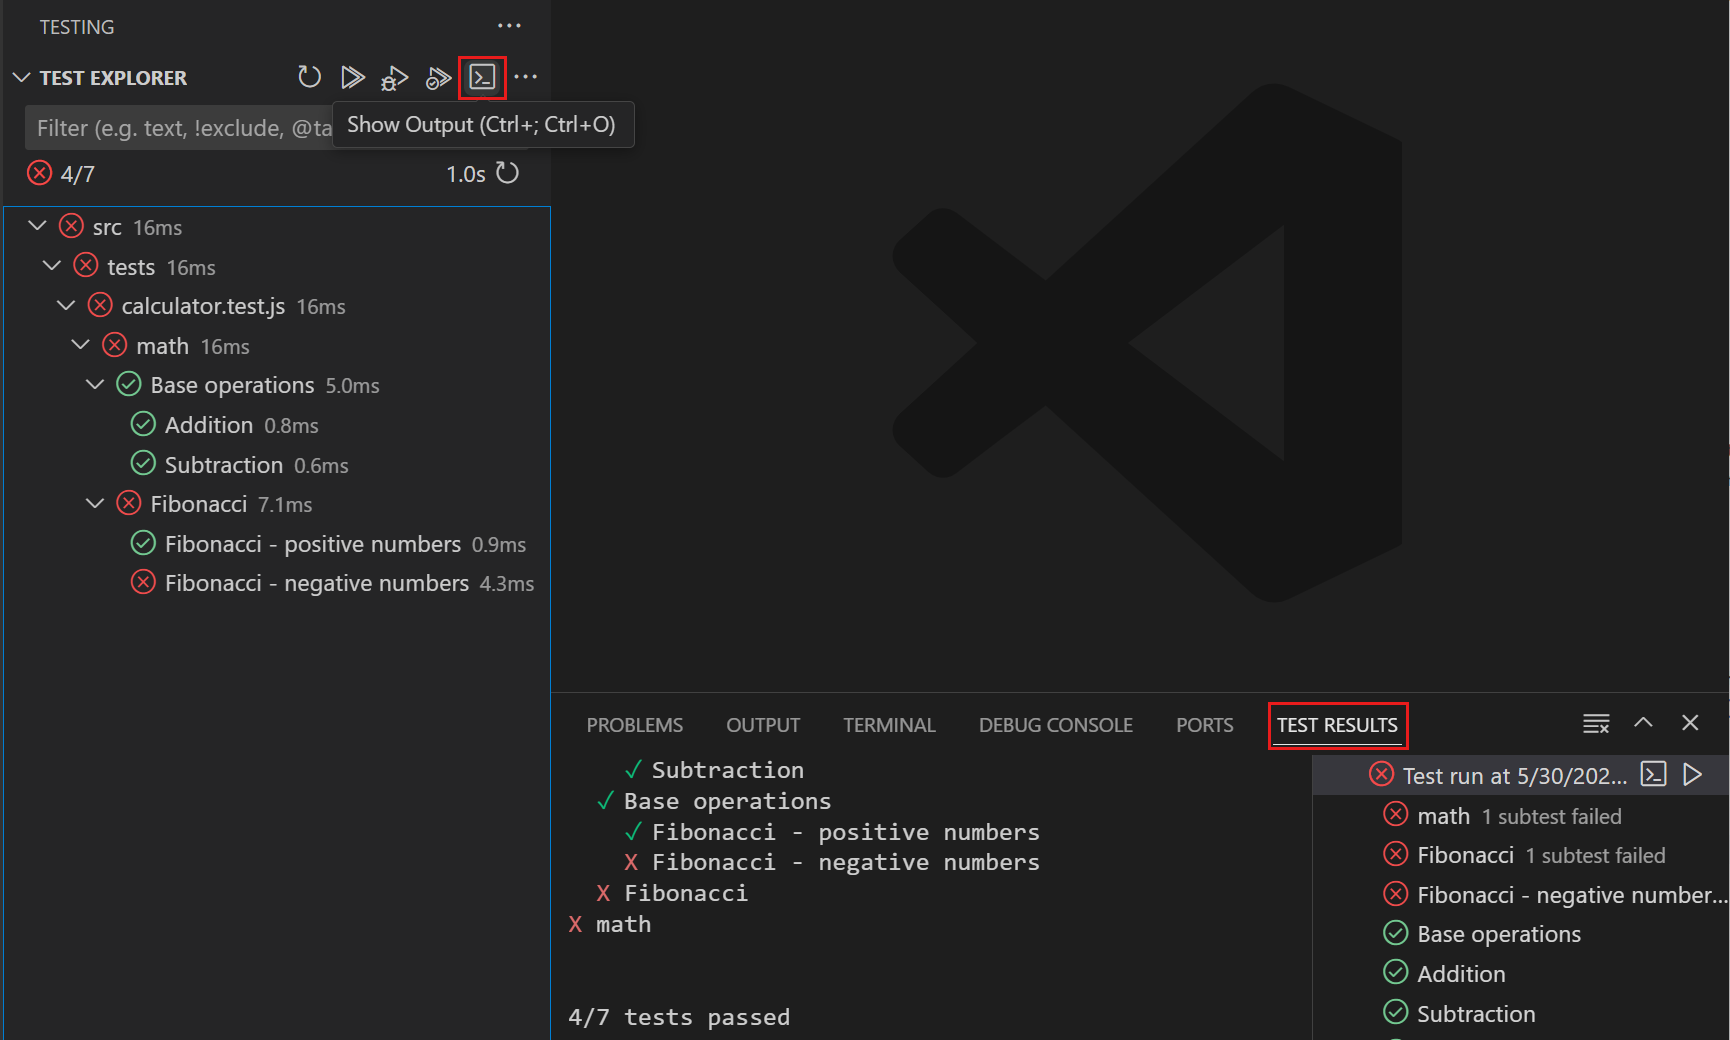
You can access the commands for the Test Explorer, such as running or debugging tests, via the Command Palette (⇧⌘P (Windows, Linux Ctrl+Shift+P)). Enter Test Explorer: to find the corresponding commands.
Test coverage
Test coverage is a measure of how much of your code is covered by your tests. It helps you identify areas of your code that are not being tested. VS Code supports running tests with coverage and viewing the coverage results if the corresponding testing extension support test coverage.
Similar to running and debugging tests, you can run tests with coverage by using the actions in the Test Explorer view, editor gutter, or commands in the Command Palette (⇧⌘P (Windows, Linux Ctrl+Shift+P)).
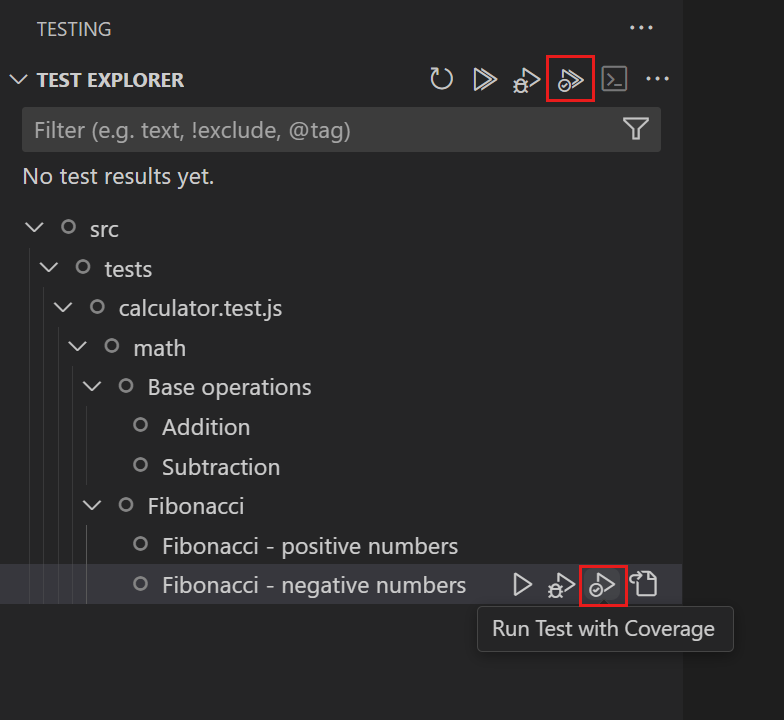
After you run tests with coverage, you can view the coverage results in different locations:
-
In the Test Coverage view
A tree view shows the tests with their coverage percentage. A color indicator also gives a visual cue about the coverage percentage. Hover over each line to see more details about the coverage results.
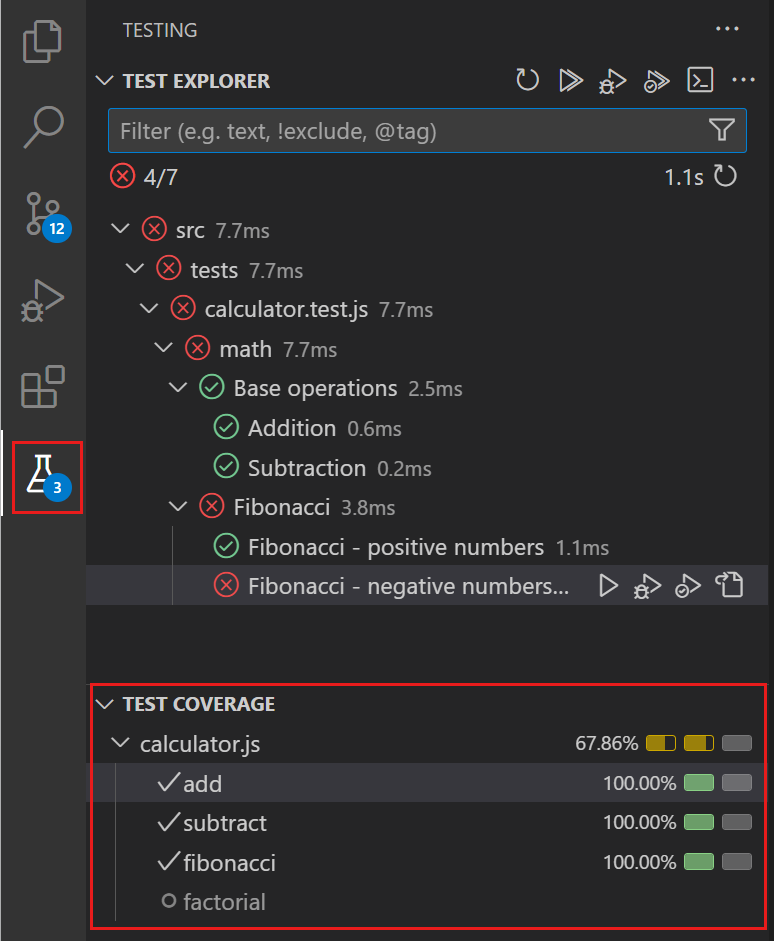
-
As an overlay in the editor
For code files that have test coverage, the editor shows a color overlay in the gutter to indicate which lines are covered by tests or not. When you hover over the gutter, notice that for covered lines, there is also an indicator for the number of times the line was executed. You can also select the Show Inline Coverage button in the editor title bar or use the Test: Show Inline Coverage command (⌘; ⇧⌘I (Windows, Linux Ctrl+; Ctrl+Shift+I)) to toggle the coverage overlay.
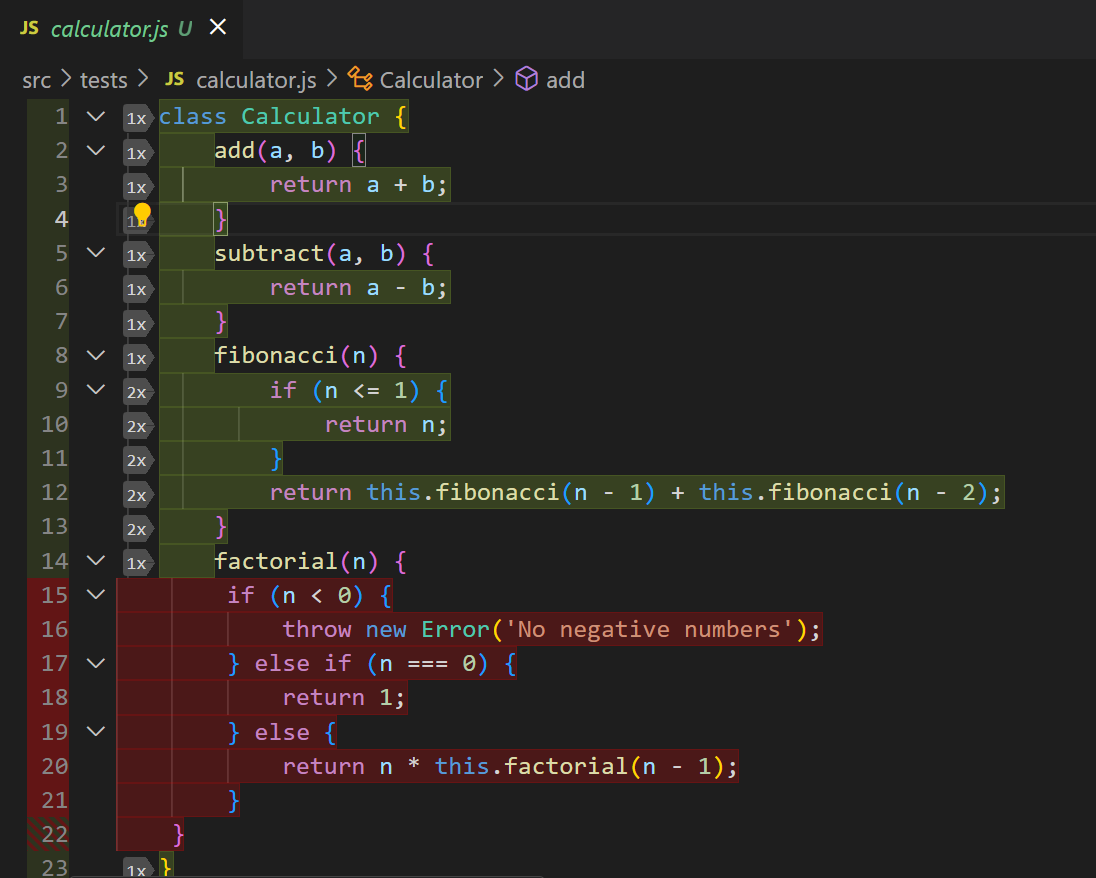
-
In the Explorer view, which shows the coverage percentage of your code files
The Explorer view shows the coverage percentage of your code files. Hover over a file or node in the Explorer to see more details about the coverage results.
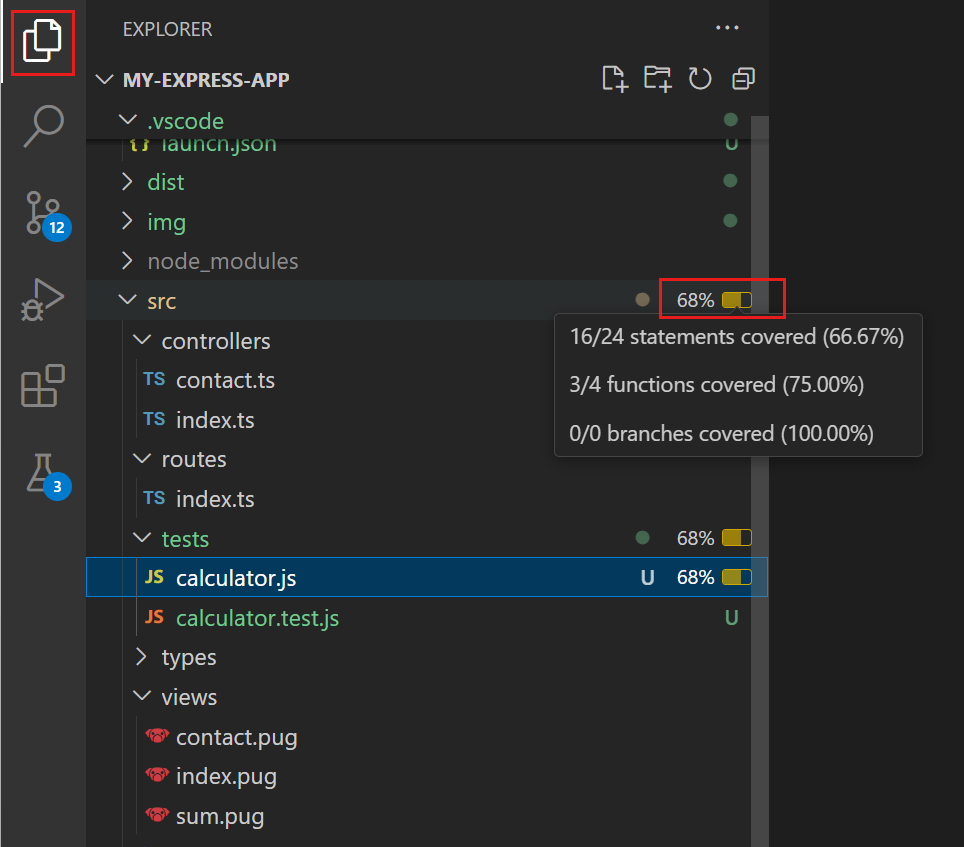
-
In the diff editor
If you have a diff editor open, the coverage results are also shown in the diff editor, similar to how they're shown in the editor.
Task integration
Tasks in VS Code can be configured to run scripts and start processes within VS Code, without having to enter a command line or write new code. In VS Code, you can define a default test task that runs your tests, and optionally create keyboard shortcuts to run the tests.
Use the command Tasks: Configure Default Test Task to configure the default test task. VS Code tries to automatically detect the test task, for example based on your package.json file. After you select the default test task, the tasks.json file is opened for you to customize the task.
The following code snippet shows a tasks.json file that specifies the node --test command as the default test task.
{
  "version": "2.0.0",
  "tasks": [
    {
      "type": "npm",
      "script": "test",
      "group": {
        "kind": "test",
        "isDefault": true
      },
      "problemMatcher": [],
      "label": "npm: test",
      "detail": "node --test src/tests/**.js"
    }
  ]
}
To run the test task, use the command Tasks: Run Test Task or create a keyboard shortcut for the command.
Learn more about using and configuring Tasks.
Note: Currently, tasks don't have special integration into VS Code's testing functionality, so running tests in a task won't update the user interface. Individual testing extensions can provide specific test automation functionality that integrates in the UI.
Test configuration settings
There are multiple settings that you can configure to customize the testing experience in VS Code. Each language extension might provide additional settings specific to testing in that language. Here are some common settings that you can configure:
You can find all testing-related settings in the Settings editor (⌘, (Windows, Linux Ctrl+,)).
Next steps
- Get started with testing in Python, Java, or C#
- Learn more about using and configuring Tasks